There is no design-based abundance estimation available for this taxon
Loading...

An interactive application for exploring, visualising, and understanding the data collected as part of the SCANS-IV observation campaign and the associated modelling results.
Explanation of the sampling methods used during the SCANS-IV aerial and ship surveys.
Two approaches used to estimate abundance, density and distribution of cetaceans
The SCANS-IV shinyApp is a complementary visualisation tool of the SCANS-IV reports available here.
More information on the survey process and modelling procedure are detailed in the reports.
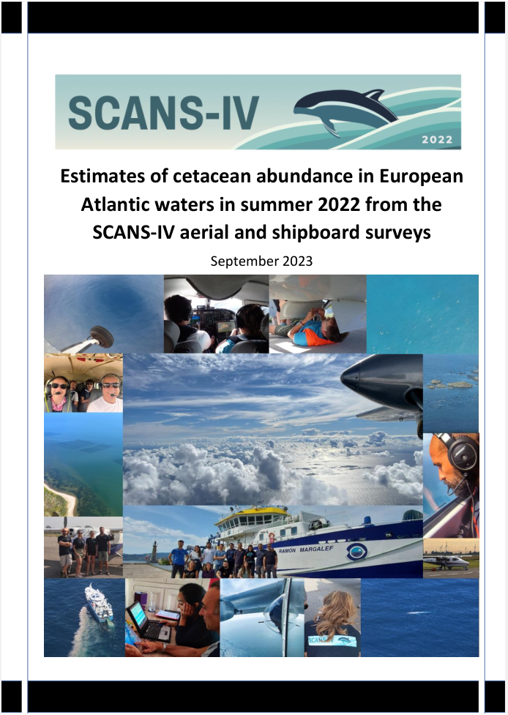
The SCANS-IV survey was designed to estimate the abundance and distribution of cetaceans across European Atlantic waters, using two survey platforms (aircraft and ship).

8 aircraft surveyed coastal and offshore regions with a large effort. Observers recorded sightings from both sides of the plane following standardised SCANS protocols.
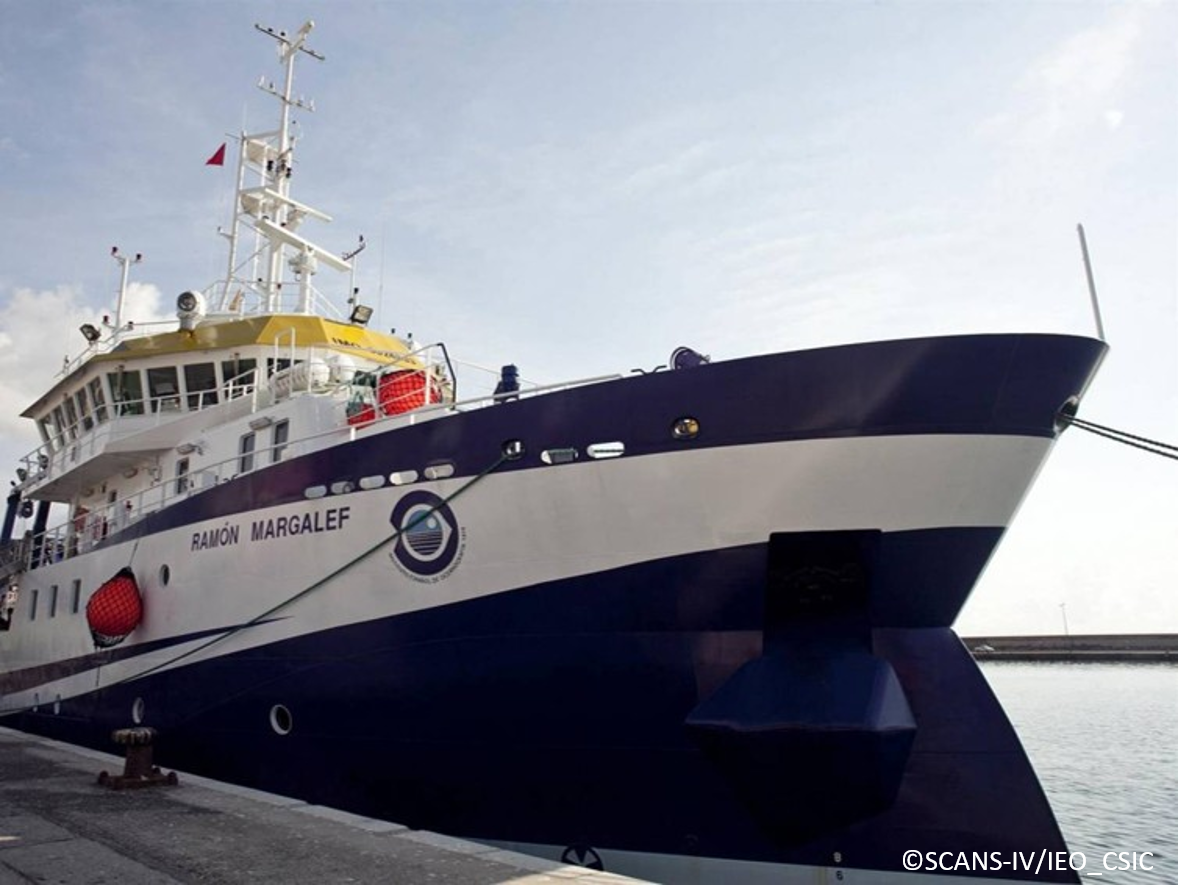
Ship-based surveys covered the deeper offshore regions of the study area using visual observers to detect cetaceans along transects. This platform allowed for longer observation times and the collection of additional environmental and acoustic data.
In the following maps :
Summary of key statistics from both aerial and ship-based sampling efforts.
In SCANS-IV, abundance was estimated using the design-based estimation approach and distribution by modelling the data in relation to environmentally-linked spatial features to generate density surface maps. Design-based estimates of abundance were generated for those cetacean species for which sufficient data were collected, also accounting for animals missed on the transect line. Density surface modelling (DSM) was used to estimate cetacean distributions using environmental and locational covariates, thereby providing spatially explicit maps useful for conservation, marine spatial planning and risk-based assessments.
Observers travel along pre-designed transects and record the perpendicular distances to the groups (or individuals). The detection probability, which is then modelled by a detection function, declines with the distance from the transect line. The survey transects within the 44 blocks were designed to provide equal coverage probability, ensuring representative survey coverage of the area thereby allowing unbiased abundance estimation by extrapolating estimated sample density to the entire block.
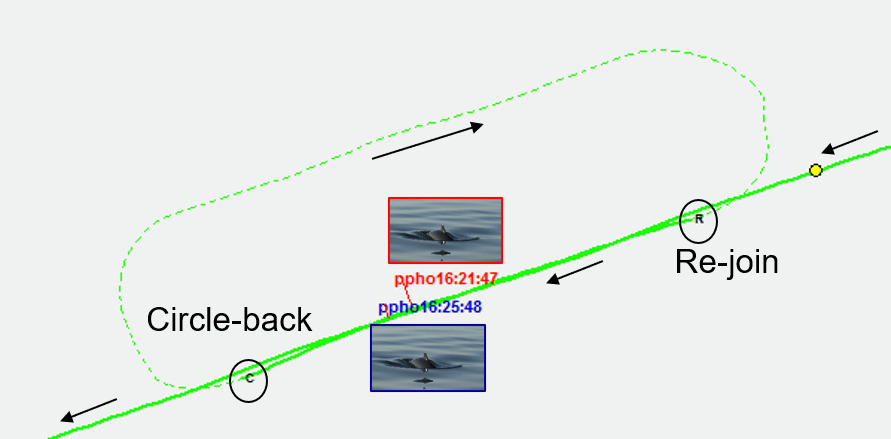
The probability of detection at distance 0, g(0), was estimated using the circle-back method, during which the aircraft re-surveyed a defined segment of transect, thereby collecting data from which perception and availability bias were estimated.
For the ship-board survey, g(0) was estimated using the double-platform configuration with two independent teams of observers, in which tracker observers searched and detected animals located far ahead of the ship and evaluated the proportion of those animals detected by the primary platform, which had a smaller search radius
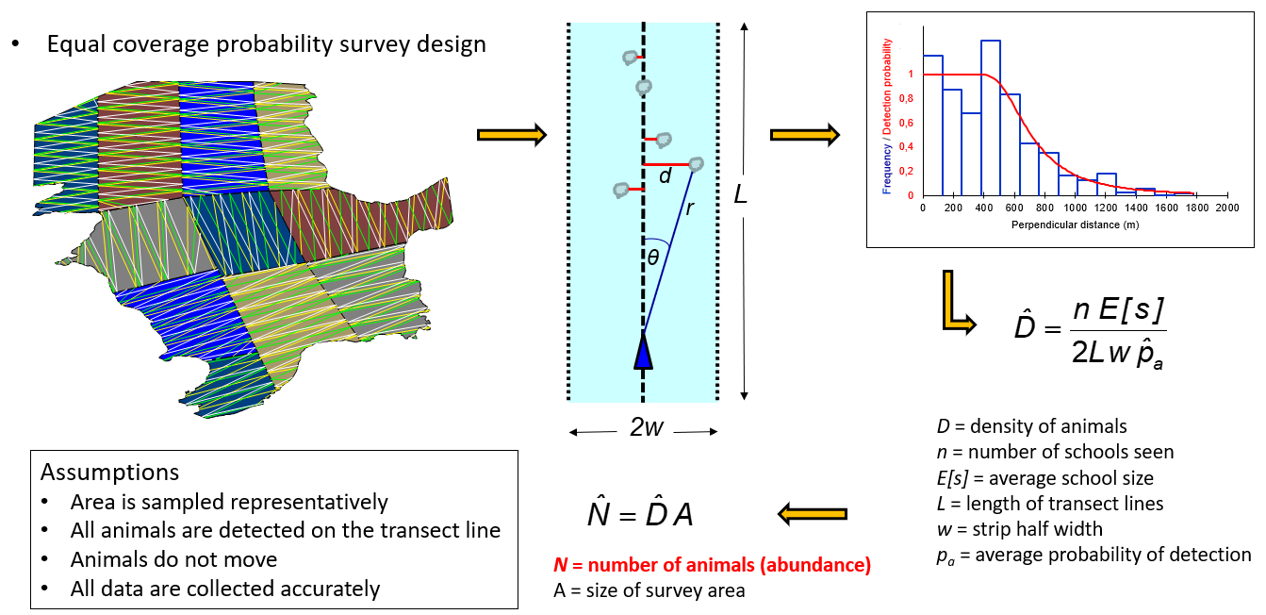
source: https://distancesampling.org/
Detection probability decreases with distance from the transect line.
DSM extends design-based abundance estimate results by modelling the spatial species distribution as a function of environmental and locational covariates. Each transect is divided into small segments (e.g. 10 km, ±10%), over which the number of sighted groups (and individuals) is summed. The number of groups (or individuals) is then correlated to the environmental and locational covariates per species or taxon, accounting for the effective area covered (that uses distance sampling theory and probability of detections, as described above). The list of covariates used for model fitting is described in the SCANS-IV modelling report, and examples are plotted on the map below. The list included 11 covariates, that were selected using Leave-One-Out (LOO) cross-validation within Generalized Additive Models (GAMs). In addition, a 'soap-smooth' spatial smoother was applied to account for the complex shape of the European shelf. This soap smooth captures any residual spatial correlation not accounted for by the covariates.
The five best models were retained based on predictive performance using "stacking", a sophisticated version of cross-validation for combining model predictions. 1 For simplicity, the model with the highest contribution to the stacked predictions was kept for visualisation purposes.
Final outputs are maps of density surfaces with uncertainty estimates.
This approach provides fine-scale, spatially explicit density estimates across the study area.
- The map below illustrates environmental covariates used in DSM, such as sea surface temperature (SST) and bathymetry
- For dynamics variables, map shows values on 24/07/2022
Together, design-based estimates and DSM underpin the spatially resolved abundance estimates of SCANS-IV.
Selected spatial layers will be generated dynamically based on your selections. The output includes geometry and selected attributes.
Raw data are available at downloading on this ICES page here